Publisher Dashboard
Welcome to your Video Discovery Platform
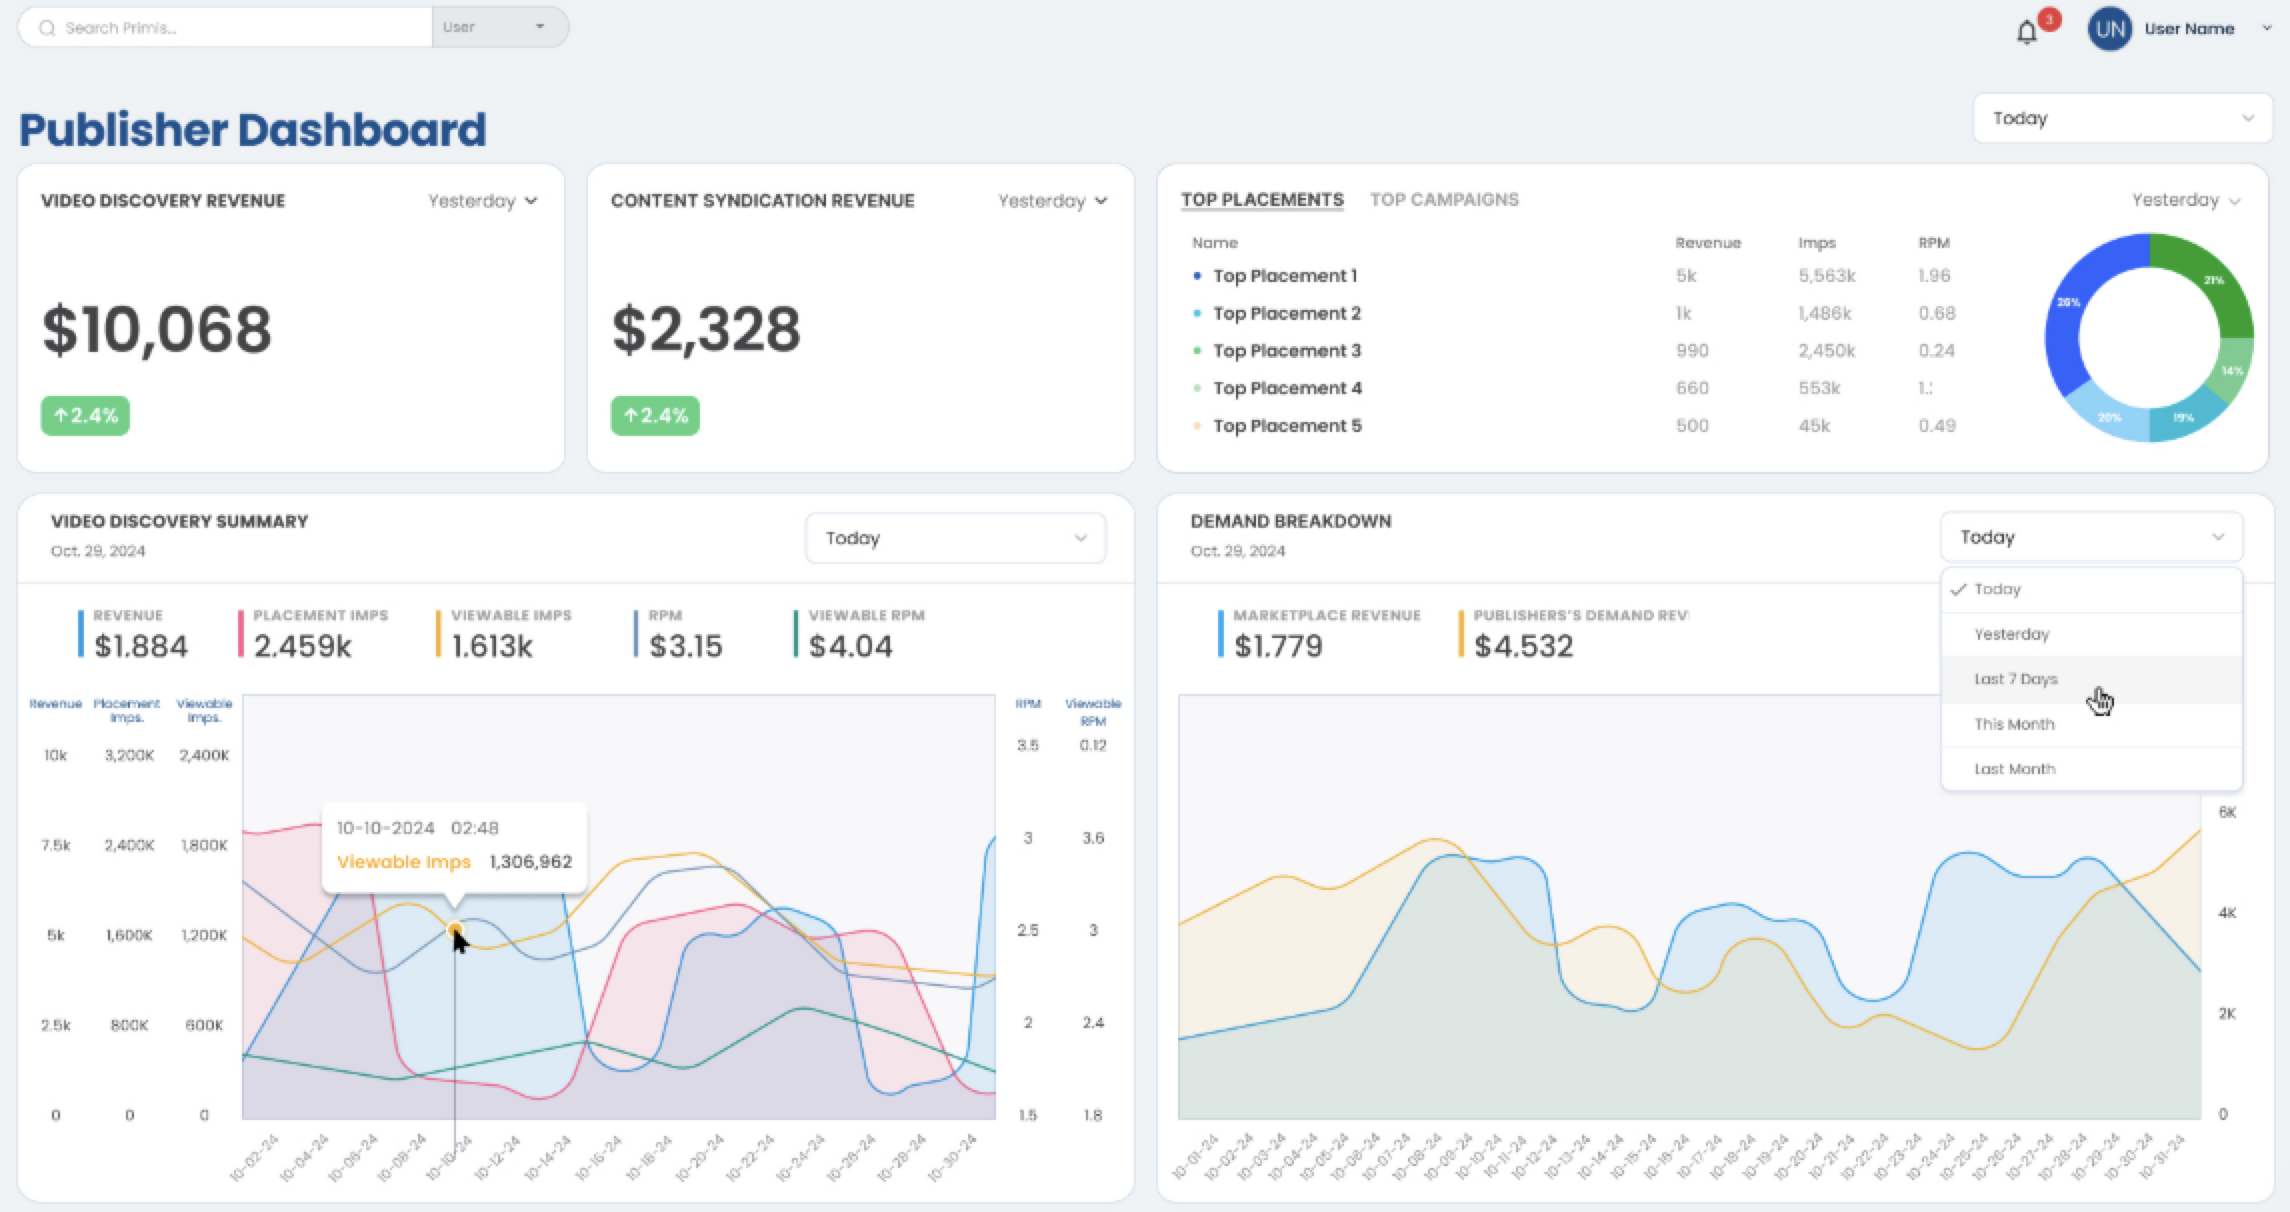
The Publisher Dashboard is your homepage for revenue insights, performance metrics, and quick highlights across placements, campaigns, content, and channels. This page helps you monitor results at a glance and identify trends over time.
What You’ll See on the Dashboard
The Dashboard page delivers a clear and concise snapshot of your video performance.
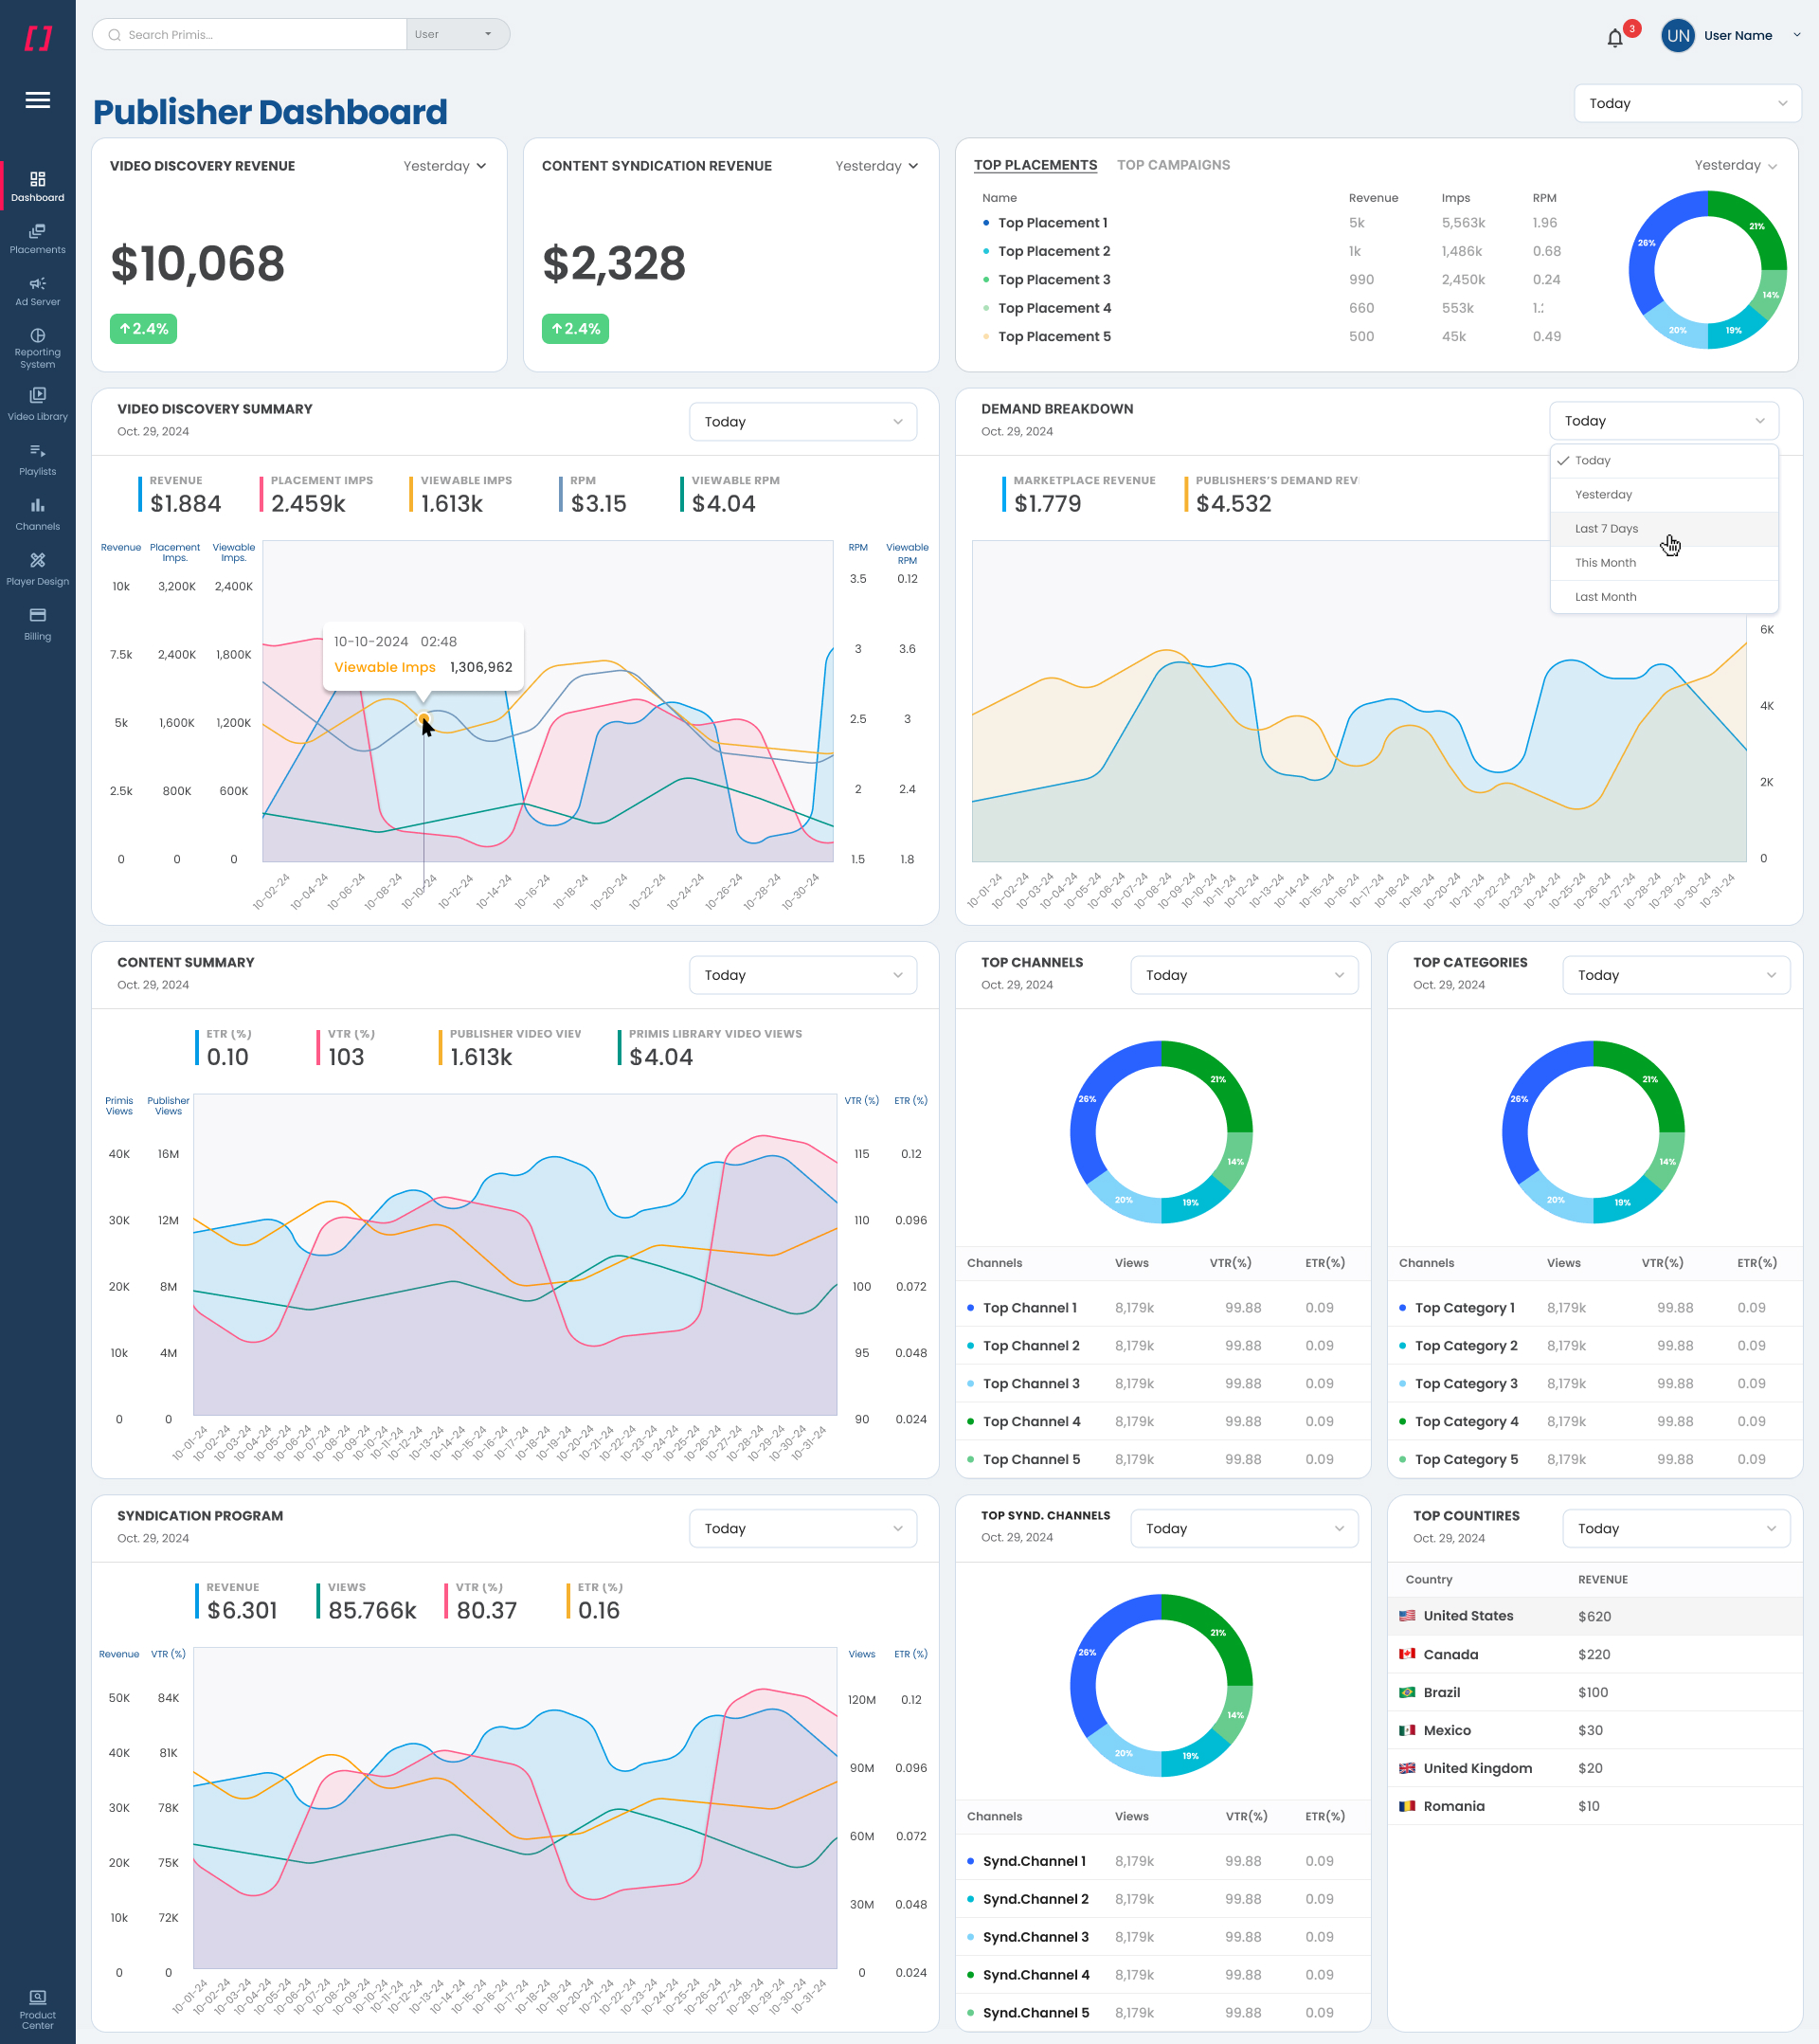
The publisher dashboard features a collection of detailed and intuitive charts, tables, and graphs.
Your Dashboard
Monetization
| Section | Description |
|---|---|
| Video discovery revenue | This is where the publisher gets an overall view on monetization. It includes metrics such as revenue, viewable impressions, impressions, RPM, and viewable RPM. |
| Top placements | This displays the publisher's top-earning placements based on revenue, impressions, and RPM. |
| Top campaigns | Here the publisher can get an overview of the performance of their own demand by campaign, revenue, impression, and CPM. |
| Video discovery summary | This is where the publisher gets an overall view on monetization. It includes metrics such as revenue, viewable impressions, impressions, RPM, and viewable RPM. |
| Demand breakdown | This graph displays overall revenue from the Primis Marketplace vs. the publisher’s demand revenue. |
Content Performance
| Section | Description |
|---|---|
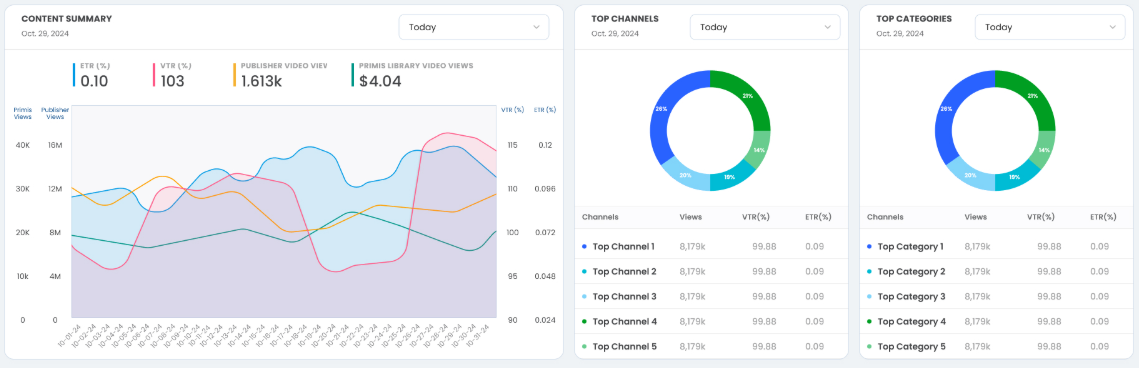
| Content summary | Provides an overview of the main metrics that publishers need to know regarding the performance of content on their domains, including; publisher video views, Primis library video views, overall engagement rate, and VTR |
| Top channels | The table and chart display the top 5 content channels that are playing on the publisher's domains with the number of views, VTR, and engagement rate. |
| Top categories | Here is where the publisher can see their top-performing content categories using the same measurements available for Top Channels. |
Syndication program
| Section | Description |
|---|---|
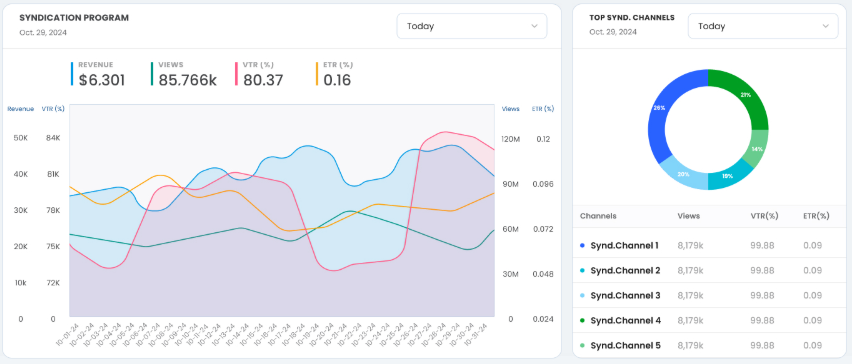
| Syndication Program | An overview of the metrics publishers who syndicate their content most want to see; revenue, views, VTR, and engagement rates. |
| Top syndication channels | This graph and table display the leading channels being syndicated, broken down by channel, views, VTR, and engagement rates. |
| Top syndication countries | This map and table rank the top-earning countries in the syndication program. |
TroubleshootingIf a widget shows “No Data”, it means there was no measurable activity for that metric on the selected date.
Updated 9 months ago
Did this page help you?